Ivan Homola • Wednesday, November 30, 2022
AUTHOR
IH
Ivan Homola, Author
Indie maker with a passion for SEO working on web projects. Ex-mobile dev-agency owner. Now, helping early stage founders turn their side projects into businesses.
Do you want to avoid big code quality problems, dangerous bugs, bad coding practices, and vulnerabilities in your code? Then, you need a tool to help you automate this process.
Automated code analysis is an essential part of modern software development. It will save you time and keep your code clean according to standards.
In this guide, you will learn about code analysis techniques and a tool that can help you to perform such automation with a few easy steps.
What is code analysis?
Code analysis examines source code to determine how it works, evaluate its structure, detect errors, and identify security vulnerabilities and other potential problems that could lead to system crashes or data loss.
It is a critical part of software development and helps ensure software quality and integrity.
A programmer or reviewer can perform it manually or by using automated tools. Mostly tools help create a high-level overview of code metrics.
The metrics are on some attributes, such as code size, the number of lines of code, security issues, dependencies deprecation, or the number of unique and duplicate functions.
The 5 most common code analysis techniques
You can use several code analysis techniques to do manual or automated code quality checks and identify potential issues.
The most common techniques include static and dynamic analysis, automated and manual review, and security analysis.
Static code analysis
A powerful debugging method identifies potential source code issues without running the program.
Dynamic analysis
It is the process of analyzing code while it is running.
It involves monitoring the execution of the code and looking for patterns that indicate potential problems, instrumenting the code to add logging or other features that make it easier to understand what is happening.
Manual review
Manual code review is the process of manually inspecting source code.
A team of developers or code reviewers typically does it. It can be time-consuming and error-prone, but it is still an important part of software development.
Automated review
These operations use automated source code analysis tools to check code for bugs, security vulnerabilities, and other quality issues. It supplements or replaces manual code review.
Security analysis
It is the task of auditing source code to find security vulnerabilities. You can do it manually or using automated tools. It helps to prevent attacks and improve application security.
Core benefits of Automated Code Analysis
Automated code analysis reduces human error by automating the process of checking source code for defects and vulnerabilities.
Thanks to tools, the errors a human reviewer would have caught have now been automatically corrected.
Below are some of the core benefits:
Scan codebase quickly
Execute code security scans to analyze thousands of lines of code in minutes and get instant feedback on code quality and best practices, saving you plenty of time.
Early detection of Bugs & Security risks
It can help you identify potential vulnerabilities and bugs early in the software development process. So you can fix them before they become a real security threat.
Improve code quality
Code analysis tools provide feedback on coding style and best standards. It helps to ensure that code is readable, maintainable, and error-free.
Also, it allows the team members to improve the code quality over time.
Difference between code review and code analysis
In the code review process, normally, a developer goes through the code line-by-line, reviewing each line of code for potential issues.
Whereas code analysis uses pre-written checks to determine potential problems with your code, saving you time while ensuring accuracy. The process typically involves automated code analysis tools that search for coding problems and other issues.
Perform automated code analysis with Codiga
Many code analyzers support the features of automating this coding process, like Lint, PMD, FindBugs, CheckStylem, and much more.
But Codiga shines more as a static analysis tool because of its flexibility, feature-richness, and all-in-one solution.
It includes:
- Get an Instant feedback report inside your IDE.
- CI/CD pipeline.
- Supports VS Code, JetBrains, GitHub, GitLab and Bitbucket.
- You can create your own custom code analysis rules.
- Quick feedback on each code review about bugs, maintainability, and security.
- Auto-check according to best security standards like OWASP, CWE, and Mitre.
Let's take a look at some practical examples.
Example:
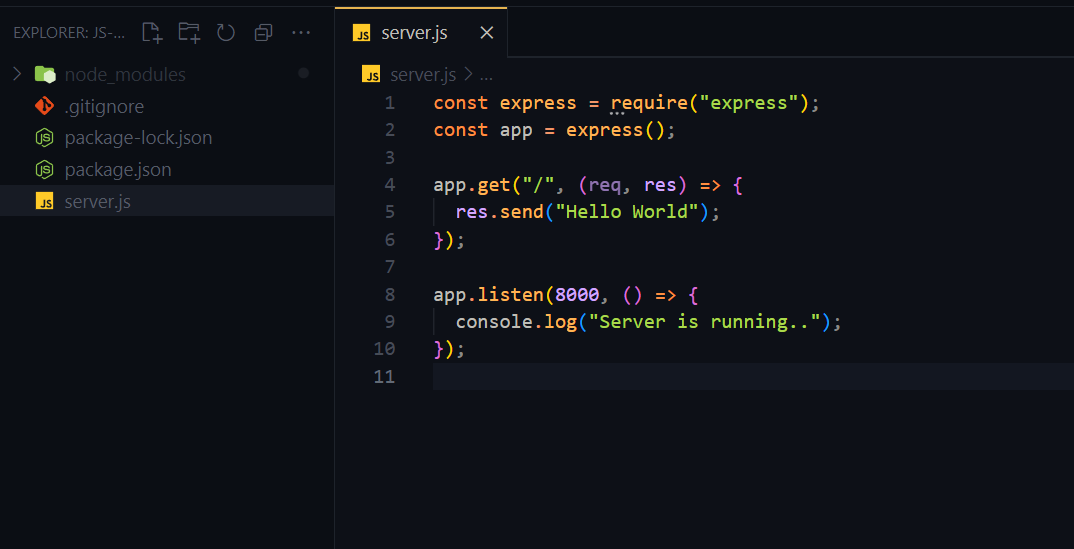
I've just created a new script and pushed it to the GitHub repository.
The goal of this script is to run the node server and allow a user to access the website's home page.
To connect the Codiga code analysis tool with your repo, you will need to follow below steps:
Note: If you don't have an account, create one for free here.
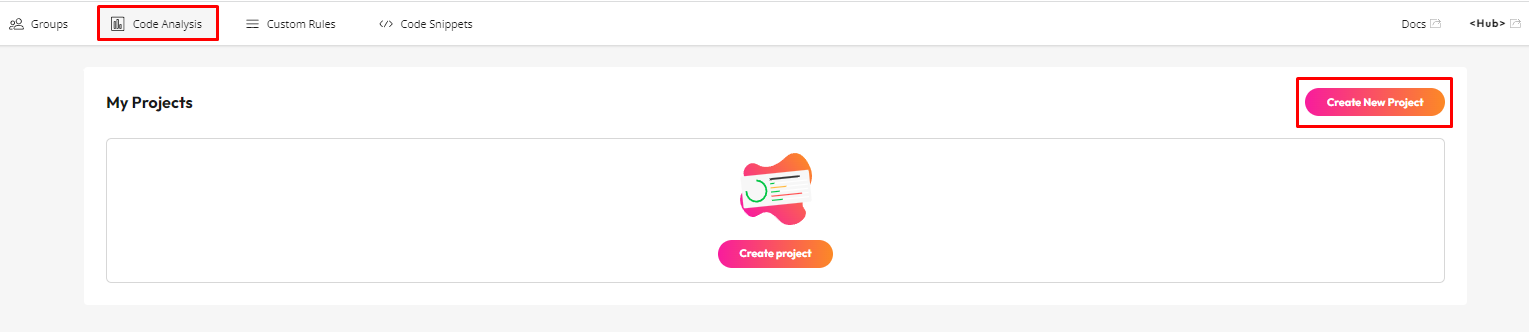
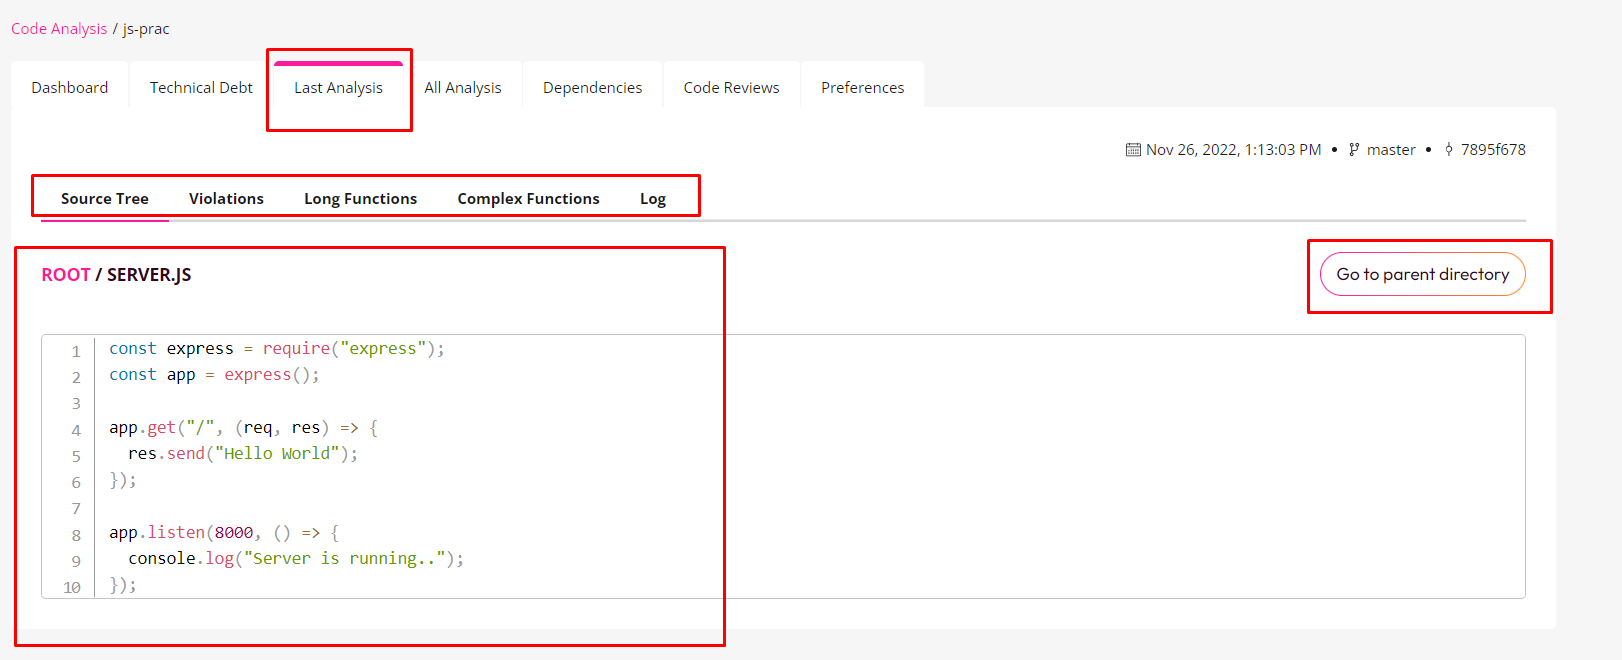
Codiga's Code Analysis Dashboard
Step 1:
First, go to the code analysis tab.
Here, you will see the list of projects you've created previously.
Otherwise, create a new project.
Note: To create a project, you must create a group and link your repository account.
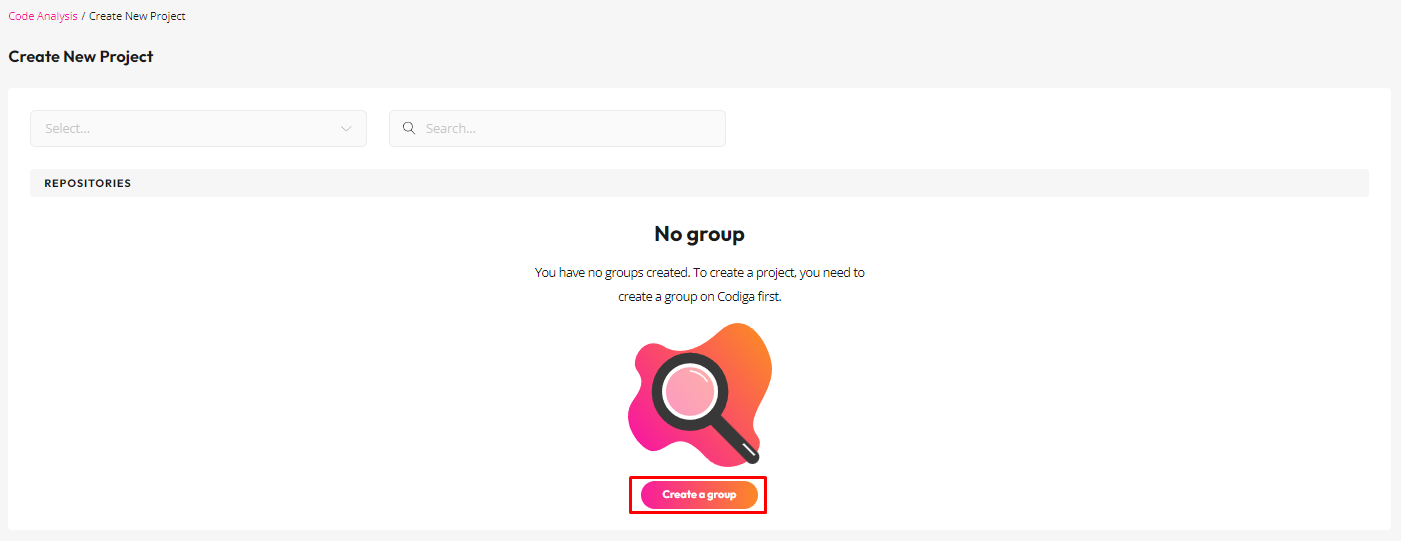
You can use GitHub, GitLab or BitBucket. Just select one and move forward.
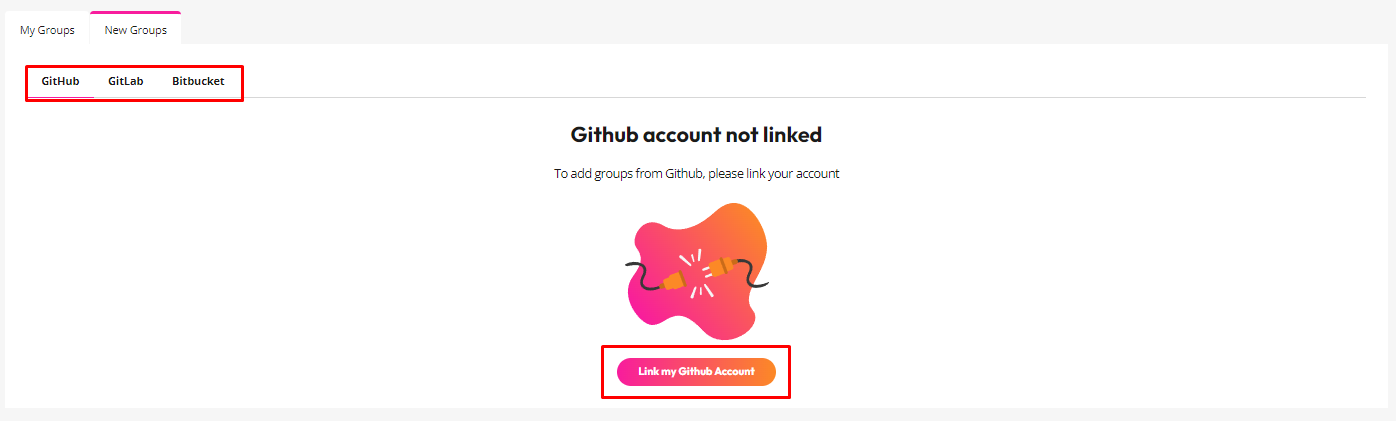
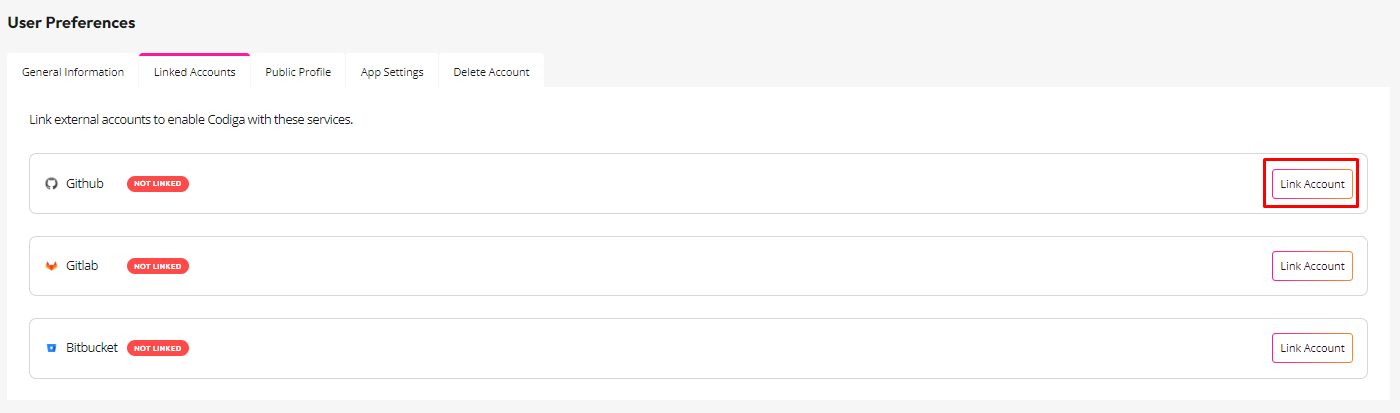
After that, you need to link your account and install the Codiga app.
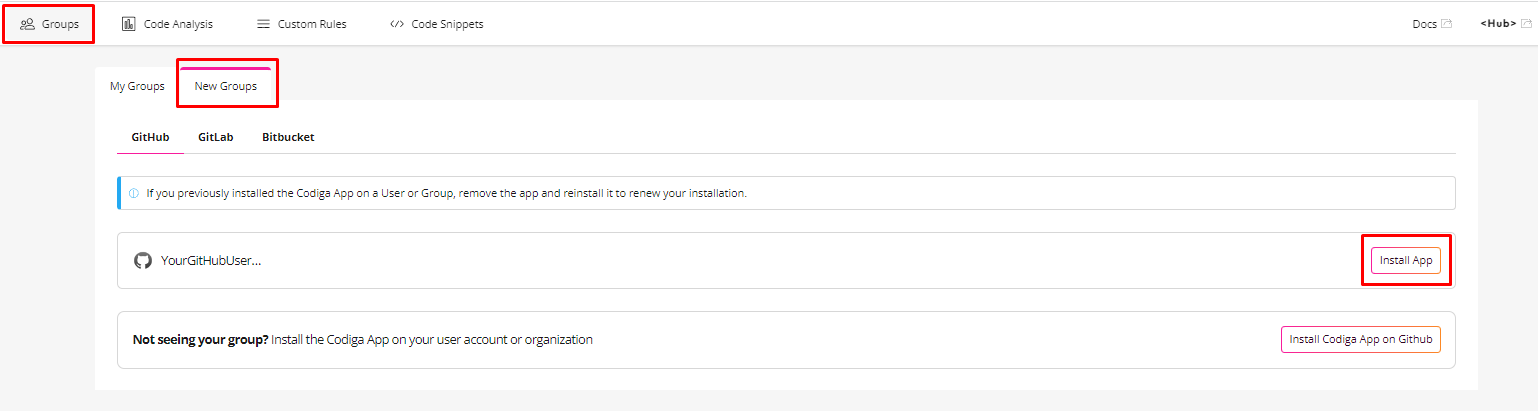
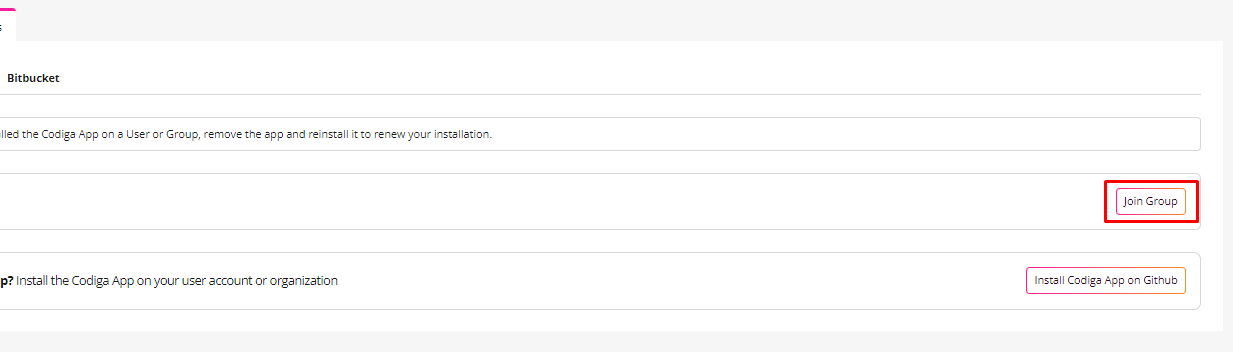
After successfully creating the group, you will see an option to join that group.
Step 2:
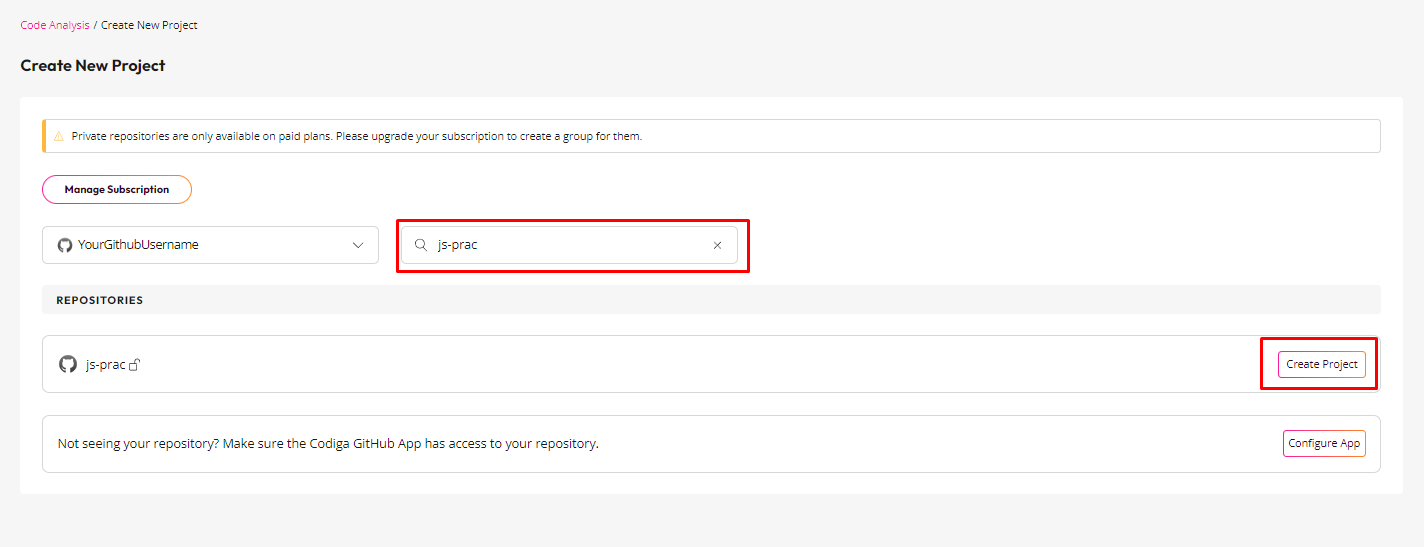
Now come back and create a new project.
Select your repository and create a project.
Step 3:
Here you will need to configure your project. Just click Start Wizard.
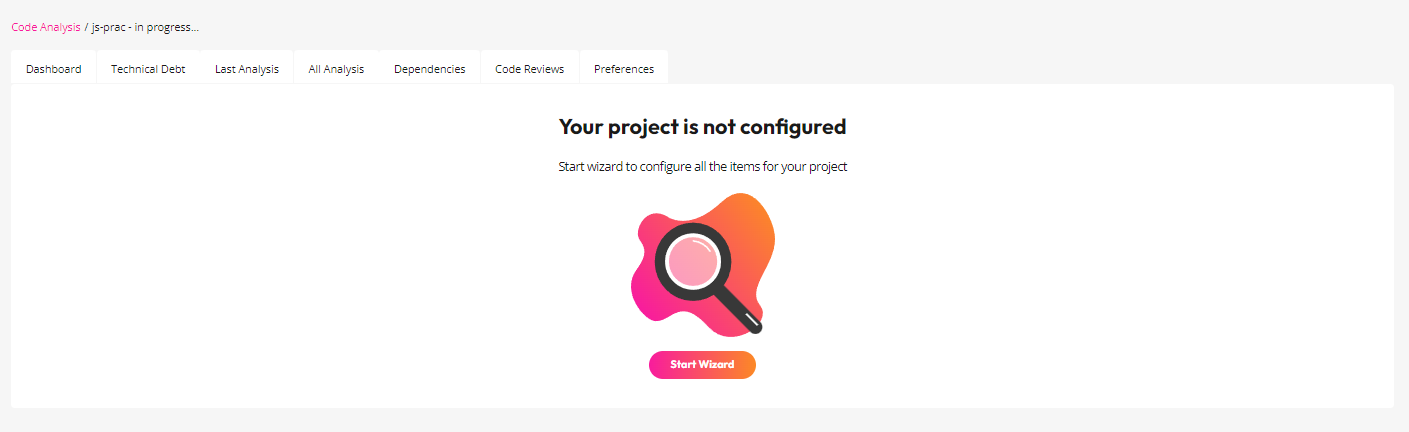
A project wizard appears from where you will have options like:
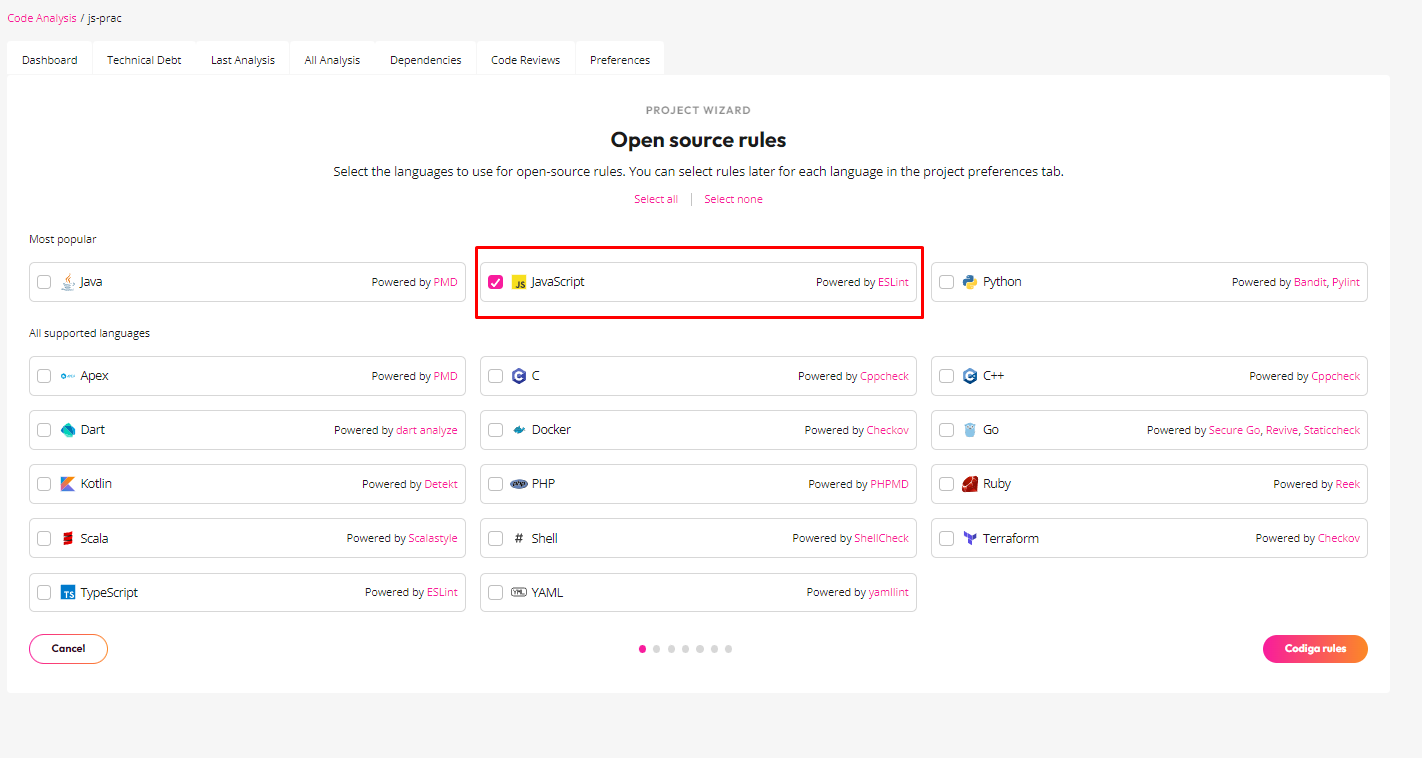
Open source rules:
You can select your preferred programming language. In my case, it's purely JavaScript.
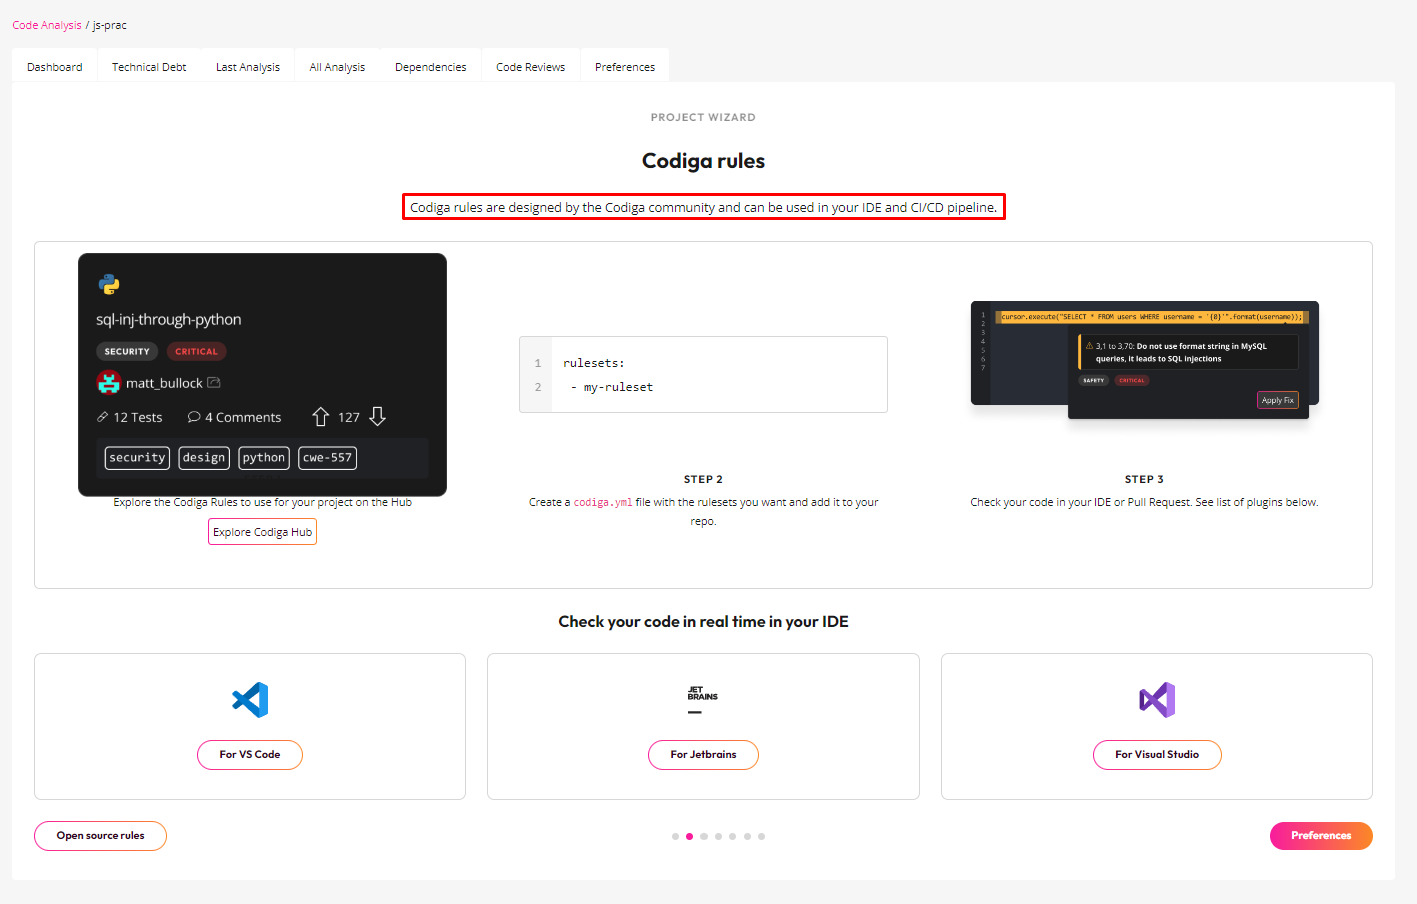
Codiga rules from the community:
These rules are from the Codiga community, and you can use them inside your IDE and CI/CD pipeline.
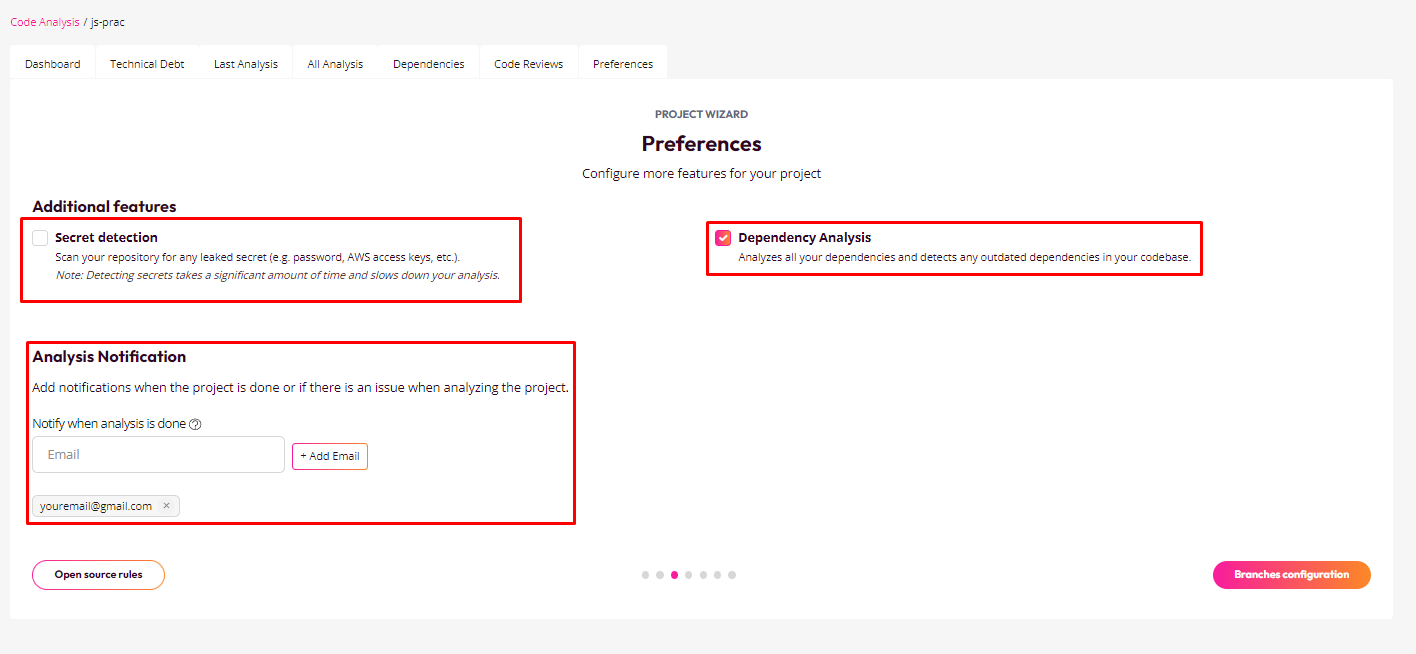
Configure Preference:
You can select:
- Secret Detection: Scan repository leaked secrets (e.g., Password, API keys, etc.)
- Dependency Analysis: (Detects any outdated dependencies)
- Analysis Notification: (Send notifications to email when the project completes or if there are any issues)
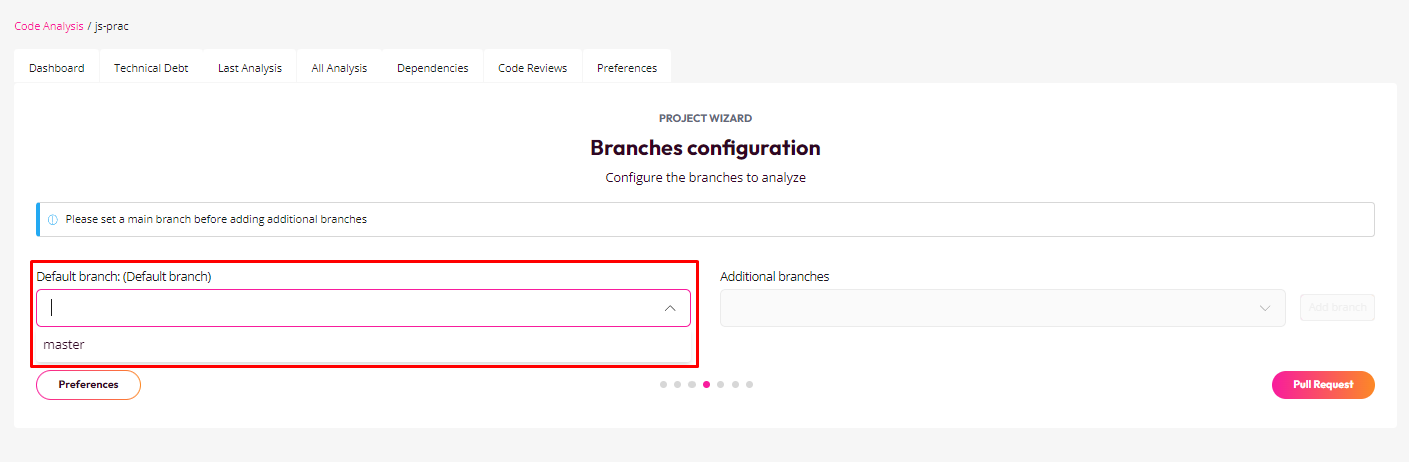
Branches Configurations:
Here, you can choose which branches should be analyzed.
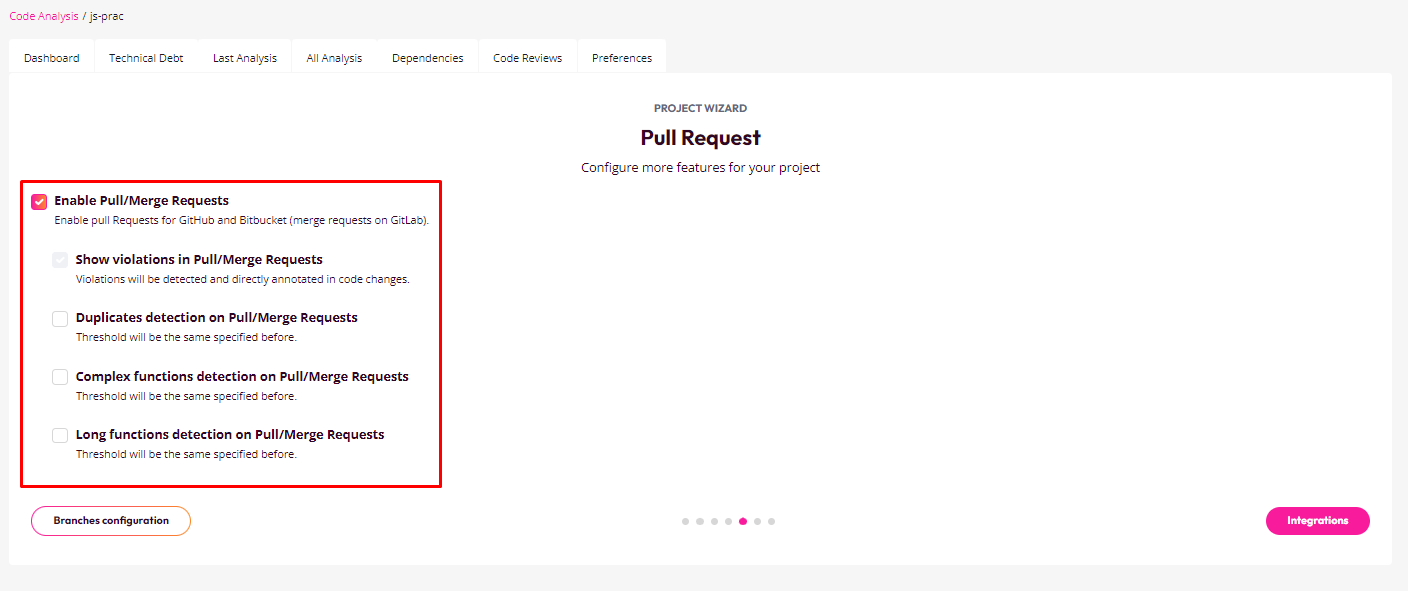
Pull Request:
You can detect the pull and merge requests.
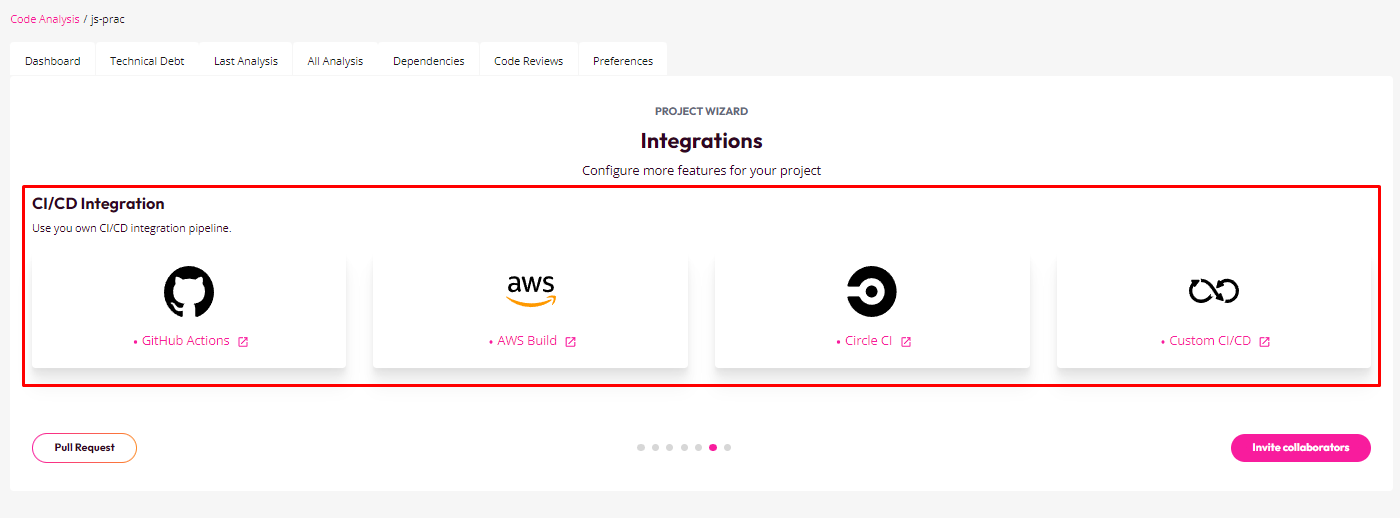
Integrations:
Select your desired CI/CD integrations pipeline. For example, if you're planning to use any like GitHub actions, AWS build Circle CI or Custom CI/CD.
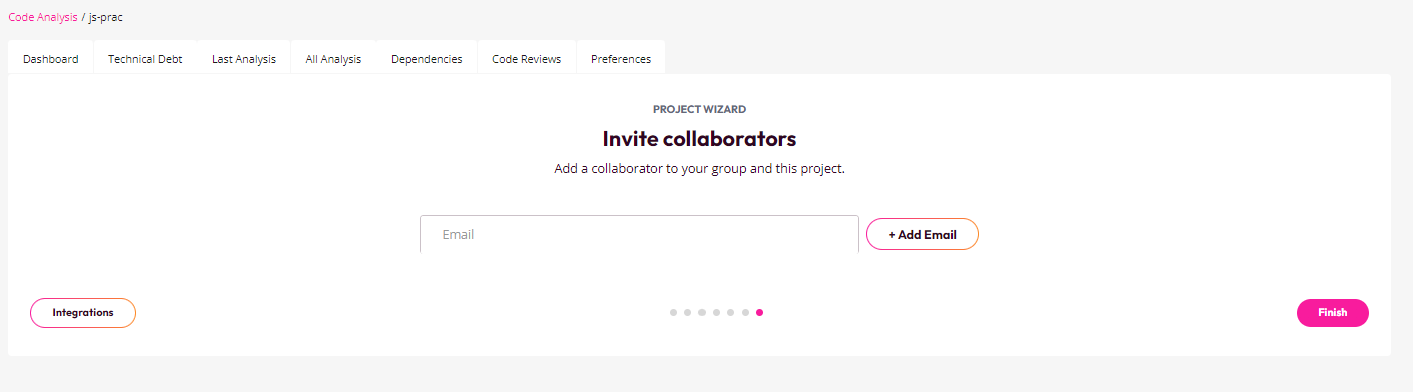
Invite Collaborators:
You can add any team member to the group and the project.
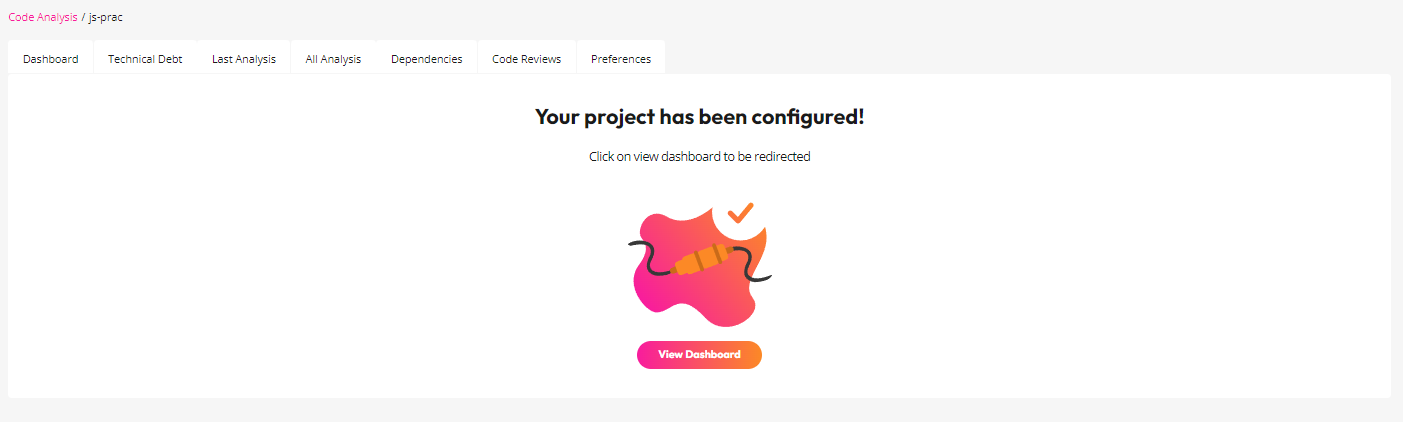
Hurrah! Successfully configured the project.
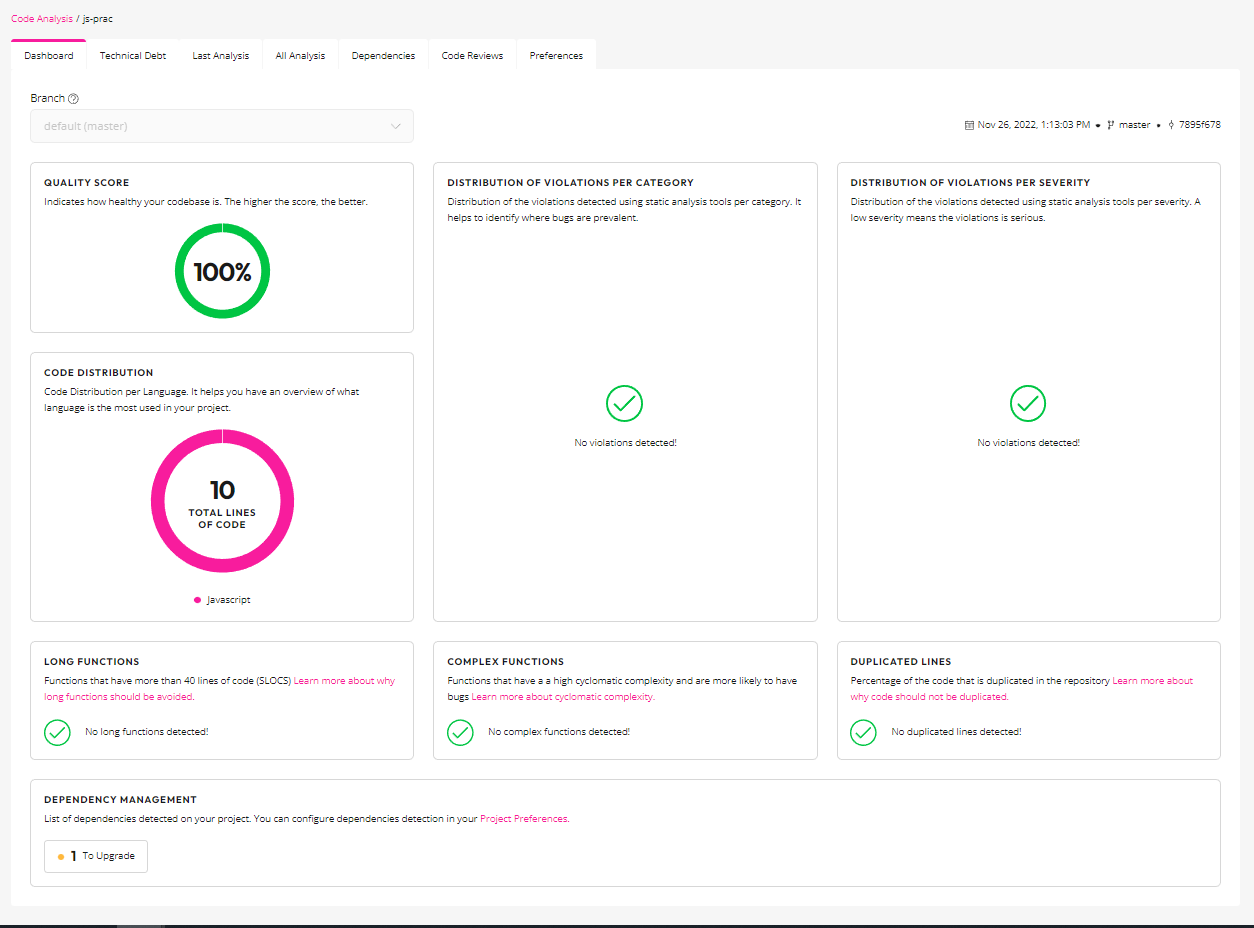
Step 4:
From the code analysis dashboard, you can view and improve the following:
- Quality Score
- Total Lines of Code
- Programming languages of the code base.
- Functions that are more than 40 lines of code.
- Distribution Violations
- Functions that are high complexity with high chances of bugs.
- Identical pieces of code.
- Dependency management.
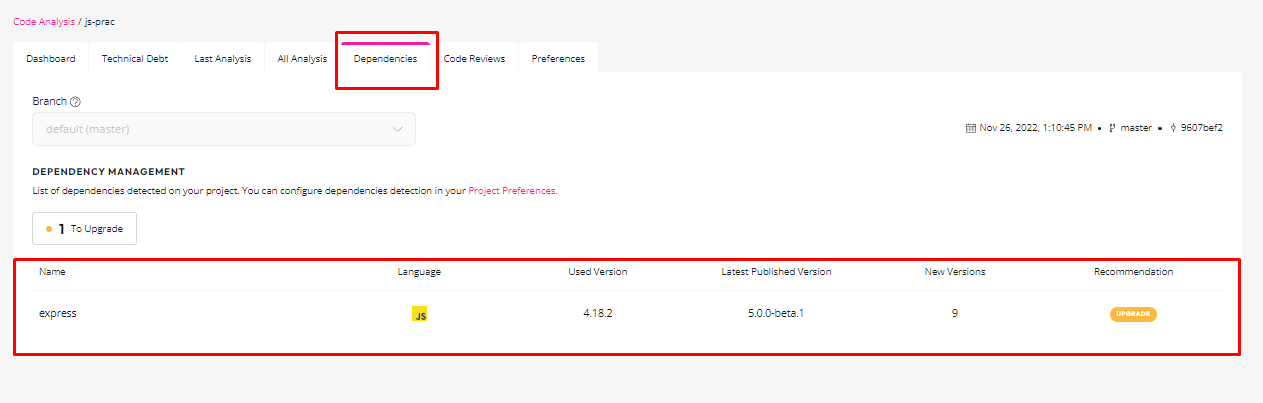
From dependencies, you can check the recommendations if you need to upgrade the package, which version you are using, and which version is the latest.
Step 5:
You can also check the source tree (files and source code).
Create a custom rule
A rule for patterns allows you to detect and emit violations or errors.
Some pre-defined python rules are already available on the Codiga Hub, like python-security, python-best-practices, etc.
Note: Right now, there is only support for python rulesets which you can create in JavaScript.
Here, I will show you how to create custom rules from scratch.
Example:
I will write a rule to detect the presence of assert foo and replace it with an assert bar.
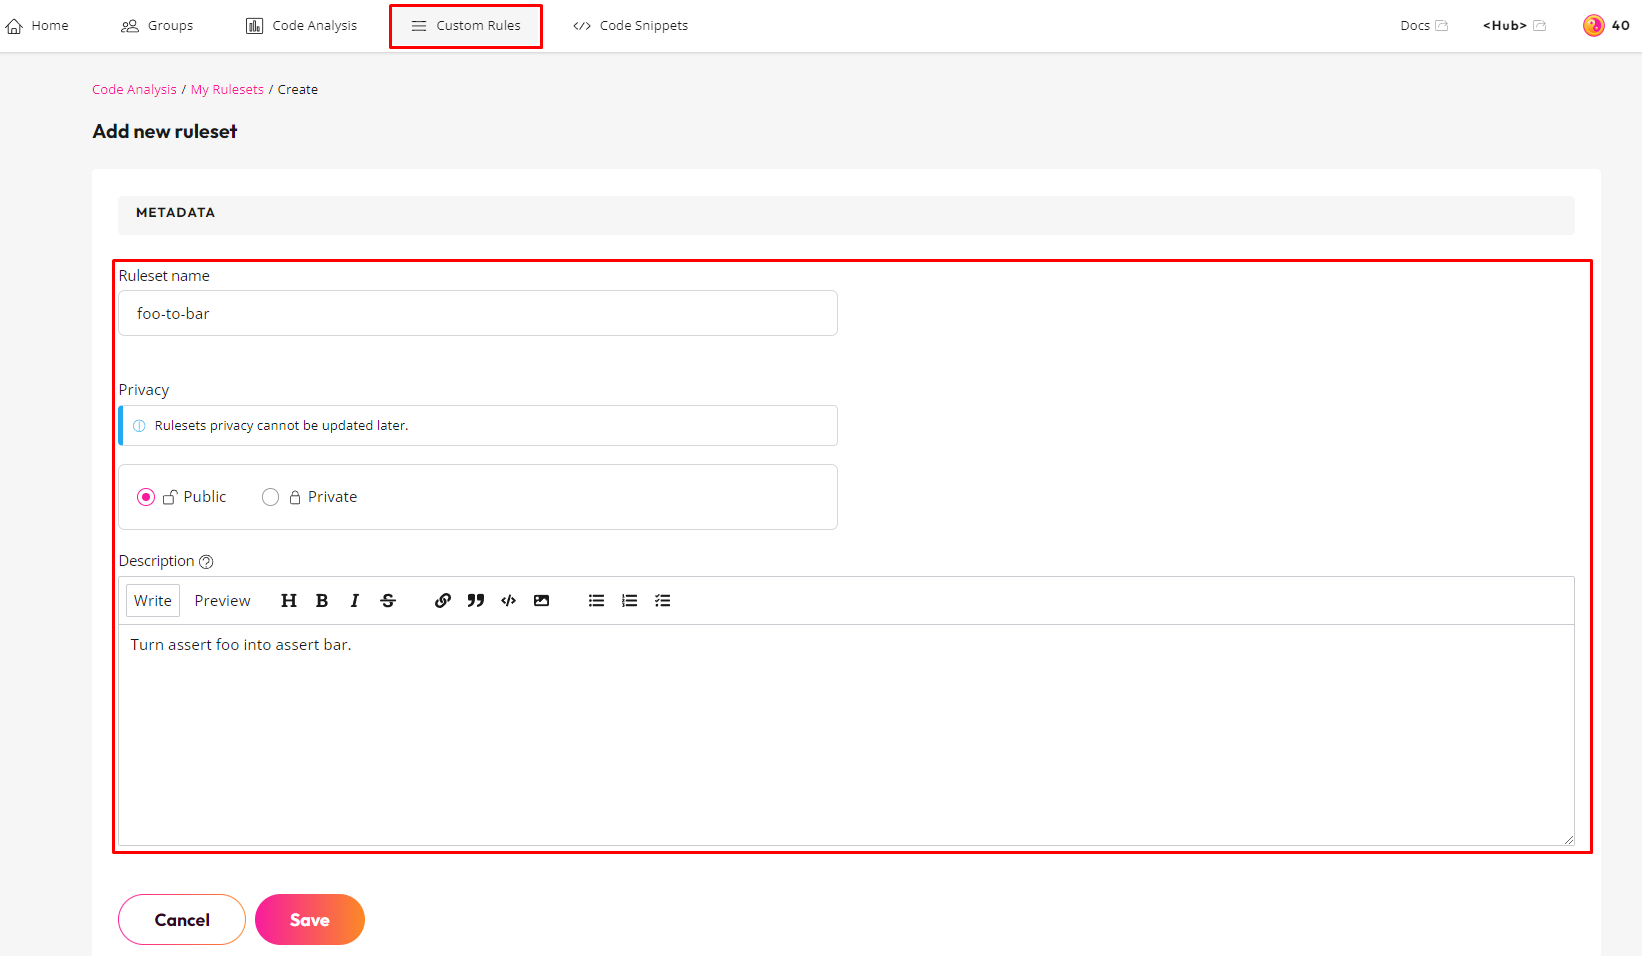
Step 1:
In this step, you will create a ruleset.
A ruleset is a collection of different rules, so any rule inside it will adopt its settings.
Note: If you are setting the ruleset's privacy to private. Then, you need to put the Codiga's access token inside your IDE.
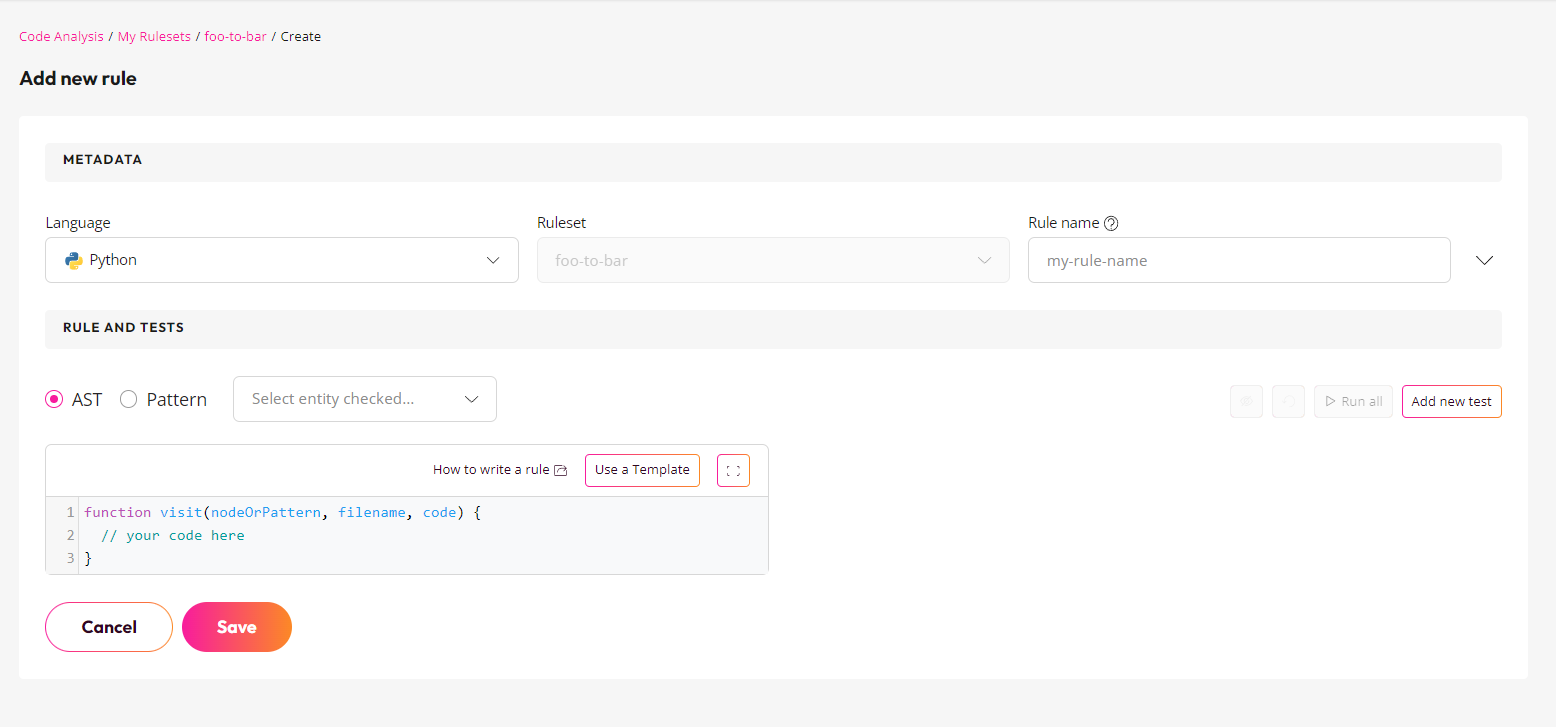
Step 2:
After creating a ruleset, we will create a rule.
There are two types of rules inside Codiga AST and Pattern. Today we will look into pattern mode.
In the input box, define the pattern like assert ${something}, where something represents the typed value.
Below, you can see a piece of code where:
- nodeOrPattern represents the pattern that matches.
- filename is the name of the file that will be analyzed.
- code is the format of code in text form.
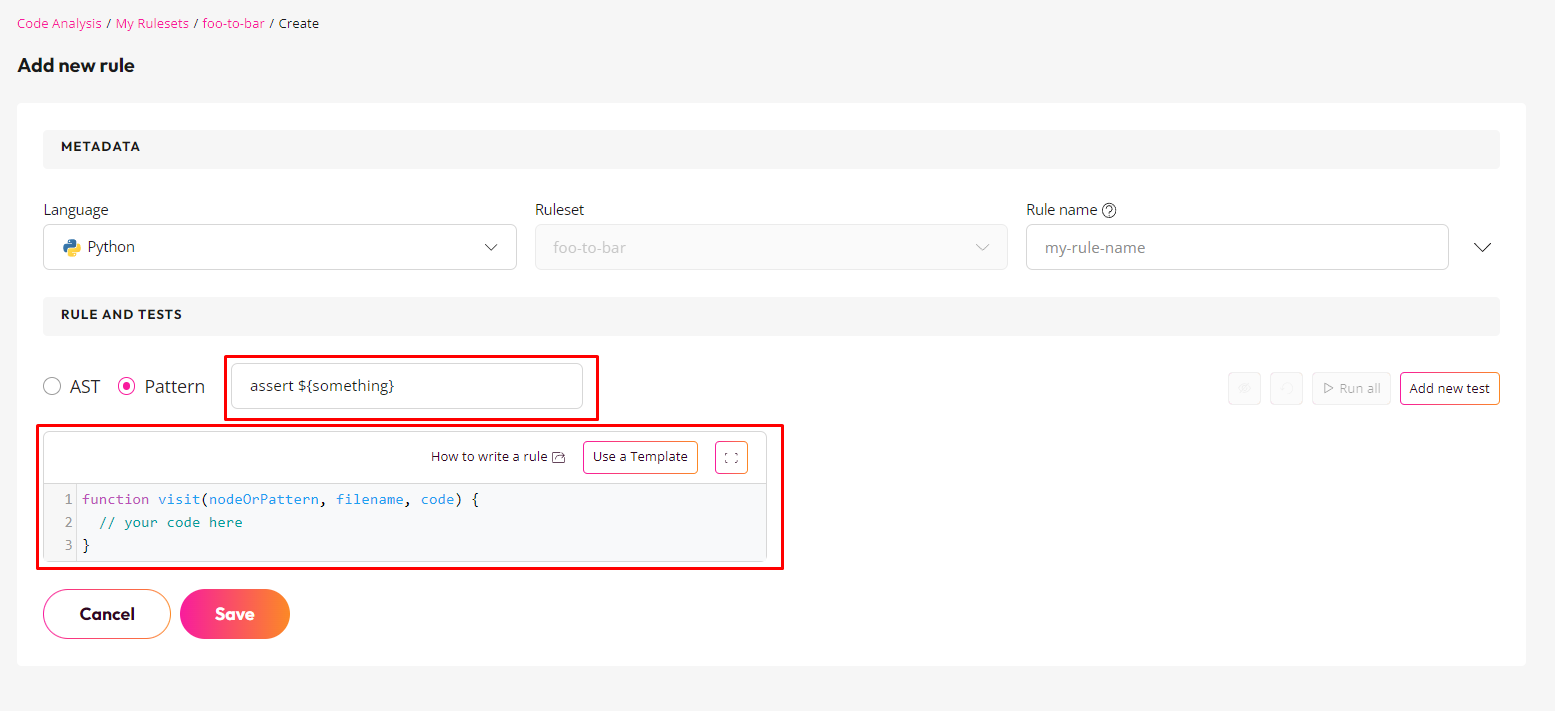
Now, let's start writing a rule code.
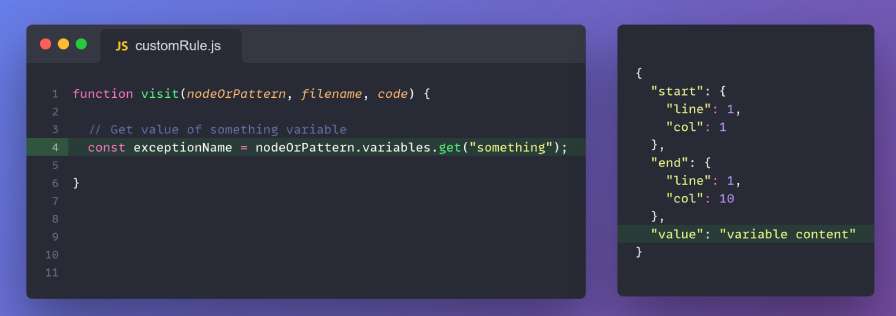
First, we need to get the value of something variable by using the following:
const exceptionName = nodeOrPattern.variables.get("something");
You can also see the object that returns with this code.
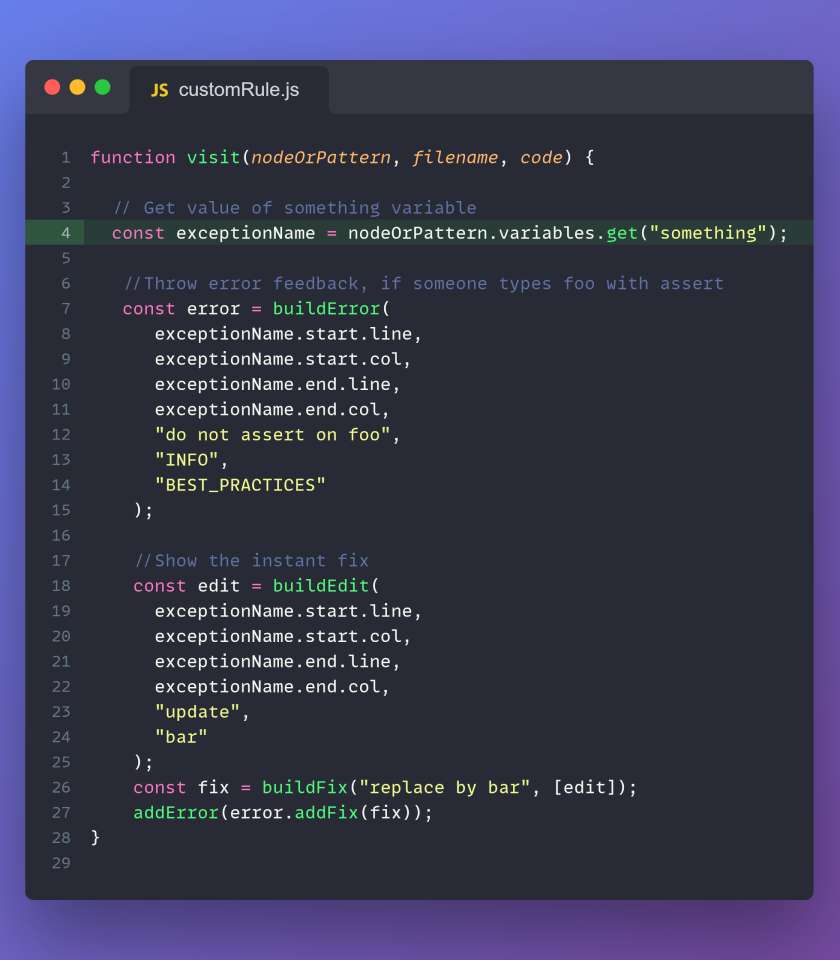
Next, we check if the pattern exists along with the value.
Inside that, we create the buildError as well as the edit.
These two will show when we type something inside our IDE. It's like feedback and the fix.
So, the final code will look like this:
Step 3:
You can test the script from the right panel by passing the file name and the code.
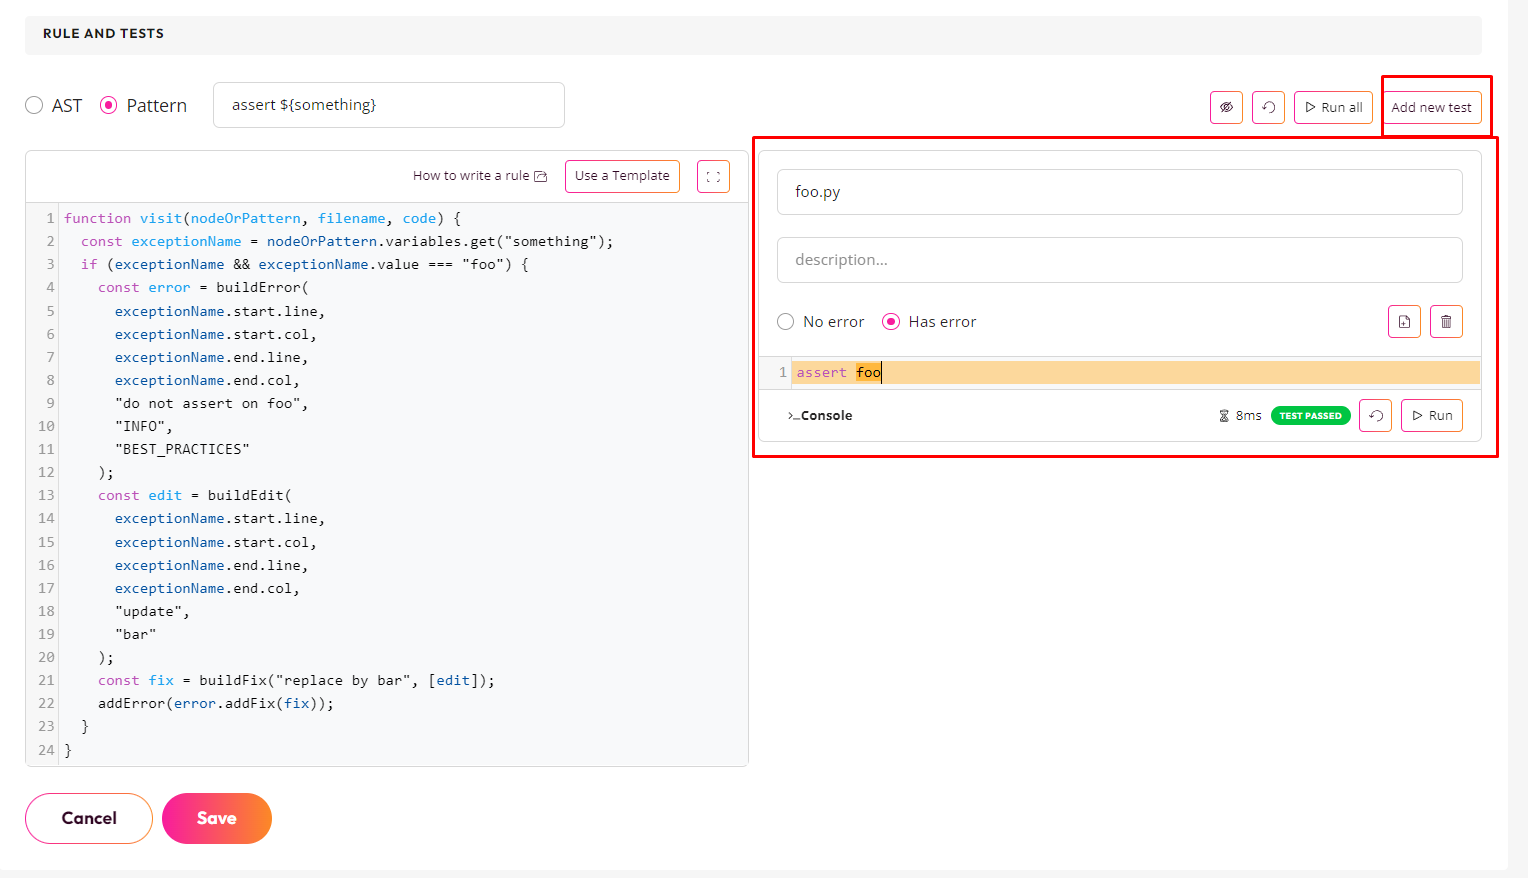
Step 4:
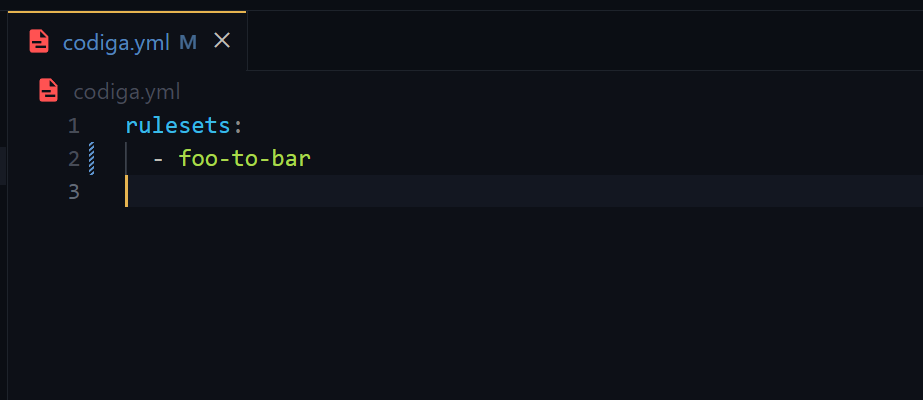
Just go to your VS Code IDE where Codiga's extension is installed, and inside your project's root, create a codiga.yml file:
We created the foo-to-bar ruleset. Our yml file will look like this:
Step 5:
Finally, to see if our custom rule is working or not. Create any python file and type assert foo.
You will see something like this:
Conclusion
So, you learned that automated code analysis is becoming a standard development process.
It helps developers spot errors quickly, improve processes, and reduce the time required to release new versions of software products.